Analyze

Analyze Stocks Efficiently

PANARAY®‘s sleek design makes it easy to analyze stocks. Our unique Datagraph® visually distills all the relevant information about a stock into one view, allowing you to apply your own investment criteria or utilize our proven O’Neil Methodology (OM).
For more information, email or call us at
800.545.8940

panaray-analyze-01

SMART DATAGRAPH


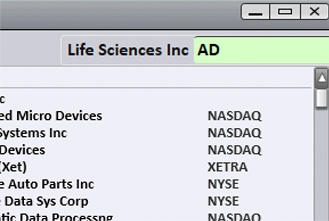
Type in a stock's ticker to quickly get the most relevant fundamental and technical data in our unique Datagraph.

panaray-analyze-02

COMPARISON CHARTS


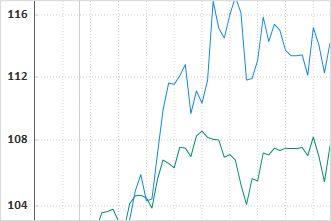
Quickly and easily compare portfolio performance with Comparison Charts.

panaray-analyze-03

LIST ANALYTICS


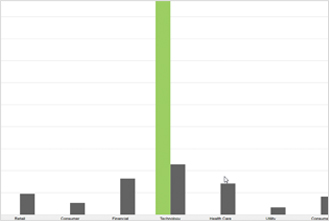
“The Datagraph answers the hard questions by putting all the pieces together: Why don’t we own this? What does the market know that we don’t?”
– Stephen Ketchmere, Senior Consultant, Institutional Client Services